


CoinMarketCap sits at the center of the crypto data conversation. Traders watch it for price moves, market caps, dominance shifts, new listings, and sector pages, while community posts add narrative—and sometimes noise.
This guide turns your raw feed into an edge: how to read CoinMarketCap correctly, what “volume” really means, why Injective’s (INJ) latest rally outpaced the market, when to treat tweets as anecdotal, and how CMC compares to its biggest rival on the one metric market makers obsess over: spread.
Why CoinMarketCap Matters (and What It Is)
CMC aggregates real-time crypto prices, volumes, market caps, and rankings across thousands of tokens and hundreds of exchanges. It also surfaces categories (DePIN, AI, L2s, etc.), exchange dashboards, and educational explainers. For builders and quants, CMC provides a robust API for live and historical data—handy if you want to script screening, alerts, or dashboards in your own stack.

For a single, authoritative starting point on the data it exposes, see the platform’s official API page: CoinMarketCap API.
Case Study: Why INJ Outperformed the Market
Community chatter flagged Injective (INJ) as “bullish,” noting a stronger 24-hour move than the broader market. The core drivers align with the headlines and on-chain product launches that users highlighted:
- GPU Derivatives Launch. Injective introduced what it calls the first on-chain market for tokenized NVIDIA H100 GPU rental rates—a novel bridge between AI-compute pricing and DeFi instruments. The aim is simple: let traders hedge or express views on real-world compute pricing.
- ETF Momentum. A Cboe BZX proposal to list a staked INJ ETF put INJ into the institutional conversation, similar to other staked-asset products that have used the same pathway.
- Technical Support. Traders noted price holding above a key simple moving average (SMA) around $14.23, which, regardless of the exact indicator set, reinforced a “buy-the-dip” bias when paired with the fundamental catalysts above.
Takeaway: when a single token outruns the tape, look for a concrete catalyst (product, listing, filing) and confirm it with a primary document (developer blog, exchange/SEC filing) before leaning on sentiment.
“Volume” Isn’t One Thing: Why Numbers Don’t Always Match
One viral complaint claimed that CMC’s 24h volume for a newly listed token on Binance Alpha didn’t match what traders saw on Alpha’s page—pinning it on an API bug. Here’s the nuance that often explains these gaps: an aggregator may define and display a venue’s activity differently from the venue’s own site (for example, showing a subset of trade types or specific market segments). When that happens, the numbers can diverge without anything being “wrong.”

That said, user-reported gaps are still valuable as early smoke: if you see persistent mismatches across multiple pairs and days, treat the volume as directional, not absolute, until you reconcile methodology definitions. A tweet can start the investigation; the venue’s and aggregator’s methodology pages should end it.
CoinMarketCap vs. CoinGecko: The “Spread %” Difference
Market makers and serious traders care deeply about bid-ask spread and ±2% depth. A widely cited advantage of CoinGecko is its per-market Spread % column and displayed depth metrics, which offer a quick read on liquidity and slippage risk. If you’re deciding which aggregator to keep open during fast markets, that single column can save you bad fills.
CMC provides other strengths (coverage breadth, categories, exchange dashboards, an active community layer), but if you live in the order book, a spread view is a time-saver.
Community Posts: Signal, Noise, and How to Use Them
CMC’s community layer can surface helpful context—big buyers, team updates, or alerts about exchange programs like Binance Alpha—but it can also amplify promotional or speculative takes. Use these as leads, not proof:
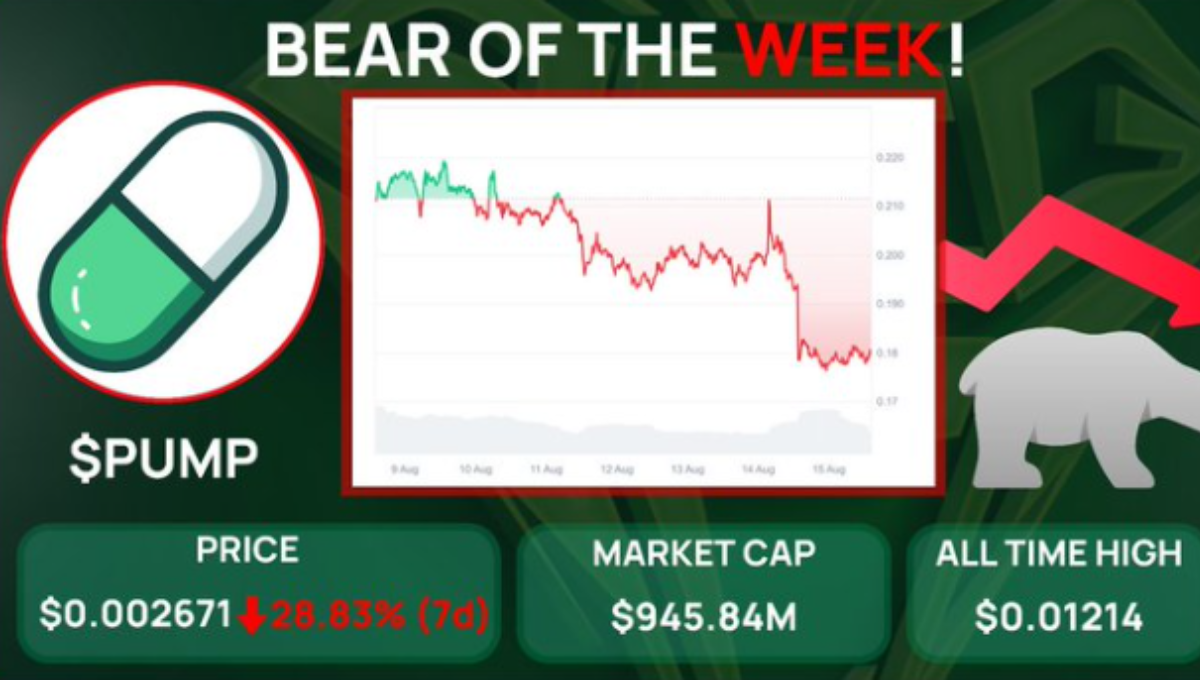
- “Bear of the week” calls. Posts flagged $PUMP plunging by 25% week over week amid whale sell-offs. Treat such recaps as post-mortems; they’re useful for learning position-sizing discipline, not for revenge trades.
- New listings & campaigns. Alpha-point “threshold wars,” multi-listing weeks, or volume surges can show up in community and “Academy” posts. These help time narrative flow, but they’re not endorsements.
- Micro-cap stats. Pages track tiny caps just as they track majors. For thin books, always cross-check market pairs and order-book depth before relying on a headline percentage move.
How to Read a Coin Page Like a Pro
- Start with the markets tab. Sort by volume and any available trust/liquidity indicators to see where real price discovery happens, then inspect the top two books for depth and slippage risk (this is where a Spread % column—if present on your aggregator—speeds things up).
- Look for filings or dev posts in the news/updates modules (ETF rule filings, protocol blogs). Catalysts backed by primary docs tend to have stickier price impact than influencer threads.
- Watch the category page. If an entire narrative (e.g., GPU/AI, DePIN, AMMs) is in motion, your token may be riding a sector-wide beta. Breadth matters.
- Check the exchange page for definitions. If volume looks “wrong,” read how the aggregator defines that venue’s metrics (internal matching vs. on-chain components, what’s excluded). Reconcile before acting.
Reality Checks on Viral Claims
“ETF rumor = guaranteed moon.” A filing is not an approval. Still, filings can broaden the buyer base by de-risking the perception of the asset, which often supports price during the news window. Read the PDF, not just the repost.
“API bug = price manipulation.” Sometimes a mismatch is a data-model difference (what the aggregator chooses to tally) rather than a broken API. Confirm the venue’s definition on the aggregator’s exchange page and cross-check with a second aggregator.
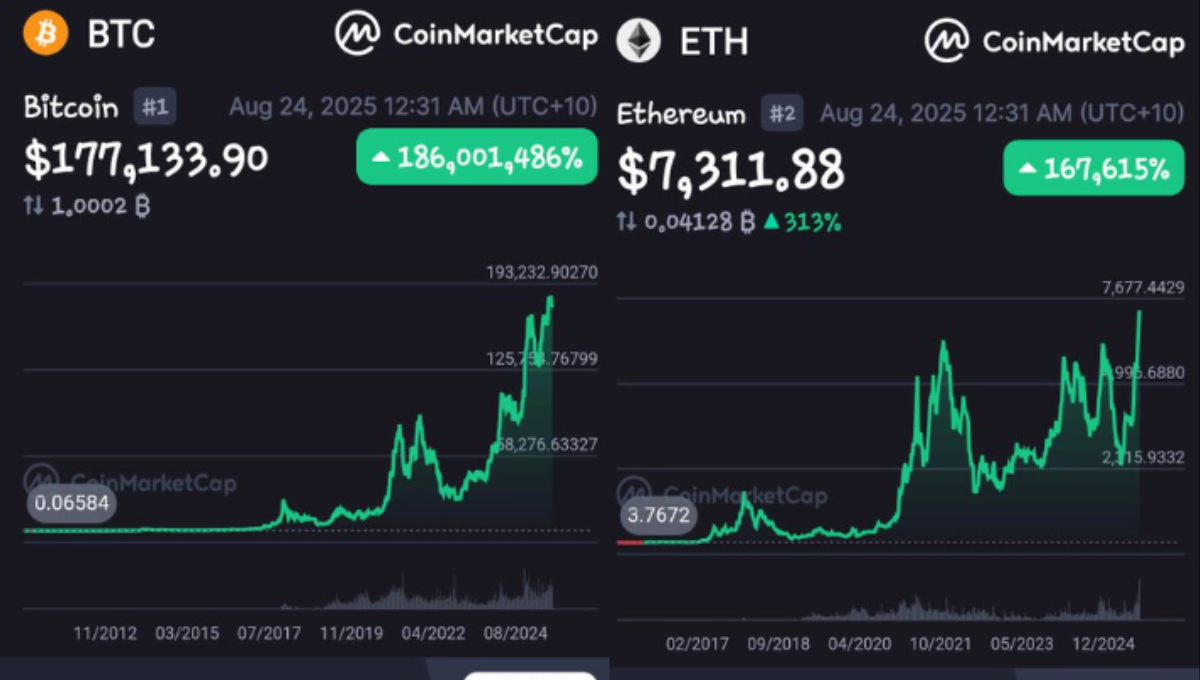
“If Bitcoin isn’t moving, alts won’t either.” Market cap concentration means BTC sets the tide, but idiosyncratic catalysts (derivatives launches, major listings, regulatory filings) can still lift or sink a single name—see INJ this month.
Micro-Caps, Speculation, and FOMO Discipline
Posts hyping 20× “if token X reaches token Y’s market cap” ignore supply schedules, liquidity, and listing breadth. Treat such claims as thought experiments, not base cases. For micro-caps tracked on CMC, the presence of a page isn’t an endorsement; it’s a data listing. Verify contracts, read audits, and always check which exchanges/pairs supply the quoted price and how deep those books are.
For example, you might see community nuggets like “GG3 is up 0.87% with a market cap just over $1 million” or “FREE jumped 54% in three days.” Those items are interesting, but without depth and venue checks, they’re not trade theses.
Actionable Workflow: Turning CMC Into a Daily Edge
- Morning scan: CMC top movers + your watchlist; open the top gainer’s page and read the news/updates first.
- Verify catalysts: dev blog → filing PDF → venue announcement. If all three align, the move likely has legs.
- Liquidity check: top two order books, volume concentration, and (if you prefer) a second-tab spread/depth check on an alternative aggregator. Thin books amplify slippage.
- Exchange nuances: on Binance Alpha names, reconcile the aggregator’s Alpha page with Alpha’s own numbers before sizing a position.
- Post-news drift: use category pages to see if a single-coin move is actually part of a sector-wide impulse (AI/compute, AMMs, etc.).
Community Highlights & Cautionary Notes
Scrolling a single afternoon of CMC-related posts will surface everything from “INJ is not bullish enough” bravado to bug reports about mismatched volumes, from calls of “bear of the week” on falling tokens to cross-site comparisons (“I love CoinGecko because they show spread %”).

You may also see speculative comps like “What if SNEK reached SHIB’s market cap?” or proud mentions of new listings (e.g., ATLA for a sports-focused chain). Treat each item as a breadcrumb that demands verification, not as a conclusion.
Bottom Line
CoinMarketCap is a powerful lens on crypto—if you pair it with primary documents and an understanding of how aggregators count things. INJ’s recent strength is a good example: real catalysts (GPU-derivatives, an ETF filing) met supportive technicals and outperformed the tape.
Meanwhile, “API bugs” and viral winners/losers posts can be useful clues, but only after you reconcile definitions, read filings, and inspect order books. Use CMC for the breadth and speed, leverage methodology notes to decode volume, and keep a second tab (e.g., for spread % checks) when liquidity matters most. That’s how you turn a public dashboard into an information edge.


