

Bitcoin News today centers on a sharp weekend drawdown and a choppy Monday open. As of press time, Bitcoin is trading around $111K, recovering slightly from an overnight low near $111K amid risk-off vibes and mechanical deleveraging in derivatives. Day-of coverage noted the slide after an earlier bounce—and a push below short-term technical levels—as traders reassessed positioning.
What just happened?
Over the weekend, BTC fell quickly toward the low-$110Ks. Market desks framed the move as a mechanics-first flush—funding turned rich for longs, liquidity thinned into the Sunday evening sessions, and a quick cascade tripped stops. Barron’s flagged the reversal into Monday, with BTC near $111,471 during U.S. premarket hours.
Was there a single “news” catalyst?
Not really. Despite plenty of social chatter, most of the move looks like derivatives-driven price discovery rather than a headline shock. When perpetual futures trade above spot, funding rates turn positive and longs pay shorts; extended periods of elevated funding often precede shakeouts as the market punishes crowded positioning. (Coinglass has a concise explainer on why high funding can be a warning sign.)
How big were liquidations?
They were meaningful. Tallying varies by data source and window, but coverage citing Coinglass showed $800M+ in 24-hour crypto liquidations during the worst of the selloff, with other snapshots earlier in the week printing in the $300M–$500M range. The pattern is the same: overheated leverage was forced out.
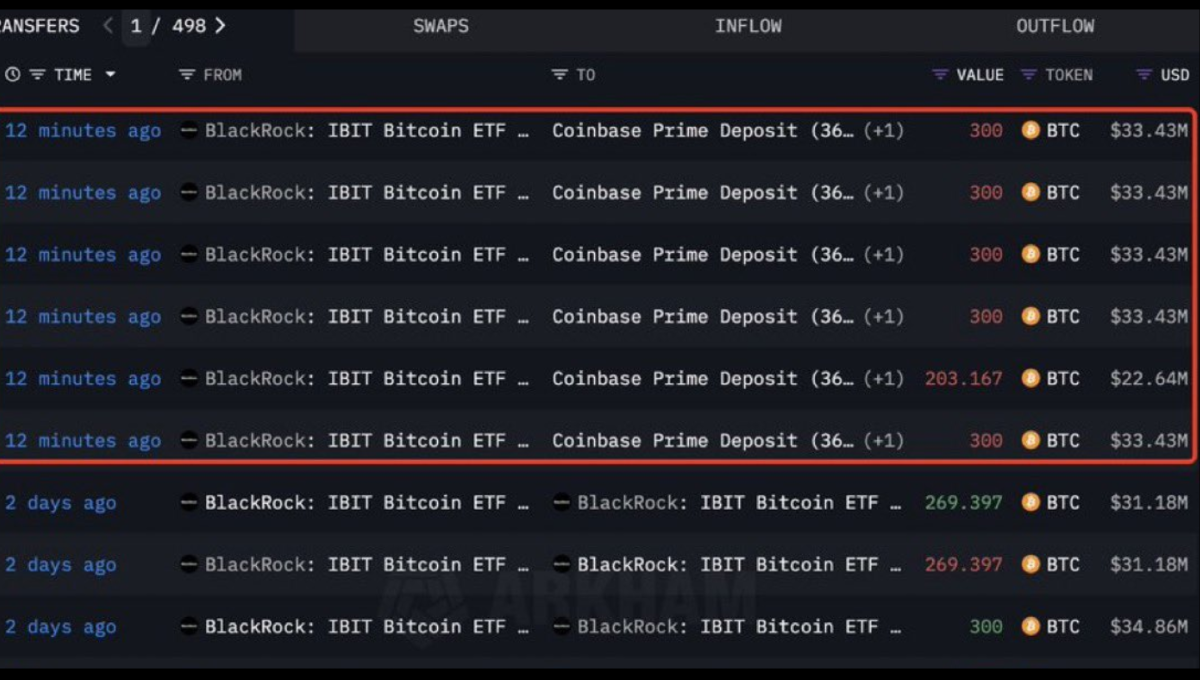
ETF flows: what’s this about “BlackRock selling $190M”?
Precision matters. Funds don’t day-trade; they see creations or redemptions. The better framing: IBIT (BlackRock’s spot Bitcoin ETF) saw net outflows on several days last week—e.g., $220.0M on Aug 20, $127.5M on Aug 21, and $198.8M on Aug 22—contributing to a multi-day drain across U.S. spot BTC ETFs.
Those outflows reduce shares outstanding and can lead custodians to deliver out BTC, but they’re not “market sells” by a fund manager pressing a button. For the rolling log, see Farside Investors’ daily ETF flow tracker.
Independent coverage tallied a six-day outflow streak across U.S. BTC ETFs, approaching $2B over Aug 19–22, underlining how quickly sentiment can swing even in an ETF era.
One handy resource: track day-by-day flows here: Farside’s Bitcoin ETF Flow dashboard.
Where we are in the bigger cycle
Zooming out helps. In July, Reuters noted BTC had reached a record high near $120K for the year, with the rally increasingly driven by institutional demand—spot ETF inflows, treasury allocations, and deeper futures participation—rather than purely retail speculation. That institutional bid tends to be “stickier,” but it doesn’t erase volatility; it just changes the who behind the flows.
Funding, open interest, and why weekends are spicy
In perpetual futures, funding rates keep contracts tethered to spot. High positive funding means longs are paying to hold; it often signals crowded bullishness and a vulnerability to “long squeezes.” Coinglass’ funding primer is a quick refresher, and Coinbase’s education page explains the mechanism for traditional finance readers. The weekend flush fits that textbook setup.
401(k)s and Bitcoin: a real new buyer—or hype?
On Aug 7, 2025, the White House issued an Executive Order directing agencies to open the door for alternative assets (including crypto) in 401(k) plans. That’s potentially a structural demand source over time—plan sponsors could opt to add spot BTC ETFs as options—but it’s not an overnight firehose.
Advisors and finance outlets stress the risks (volatility, fiduciary duty) and expect a gradual rollout. Translate: policy green light ≠ immediate flows; it raises the ceiling rather than filling the room.
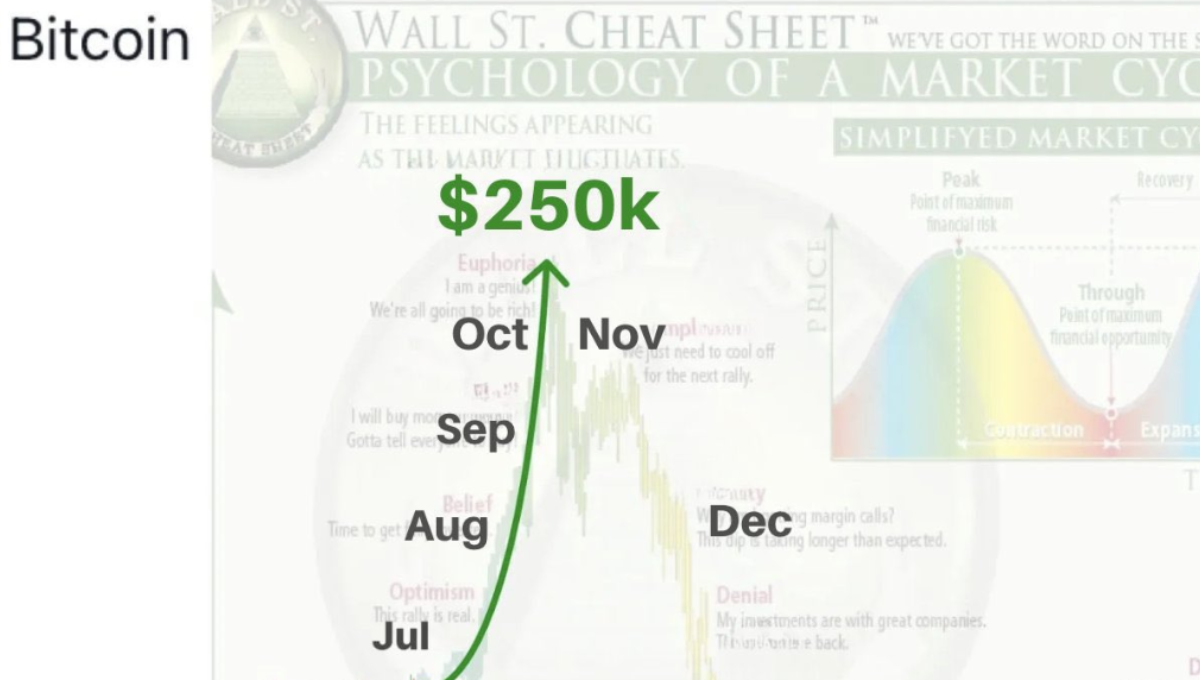
Price targets: $200K–$250K this year? $1M+ someday?
Bold targets are back. Fundstrat’s Tom Lee has reiterated a $250K Bitcoin target for year-end 2025, while many social accounts tout $200K paths tied to 401(k) access. Meanwhile, maximalists like Michael Saylor continue to argue for a “supply shock” as institutions and high-net-worth investors accumulate. Treat these as scenarios, not promises; the same leverage that amplifies rallies (ETF creations, futures basis) can unwind brutally when conditions change.

What the tape is saying right now
Short-term: BTC remains heavy below recent highs, with intraday bounces capped near the mid-$110Ks. Barron’s noted a break under the 50-day moving average; momentum traders will watch whether price can reclaim that level on expanding volume. If not, the market may probe deeper liquidity pockets in the upper-$100Ks.
Actionable ways to read this market (not financial advice)
- Track ETF flows daily. Consecutive outflows often align with risk de-grossing, while strong creations can fuel squeeze-y up-moves. The Farside table is the fastest overview.
- Watch funding & open interest. Aggressively positive funding plus rising OI into resistance is tinder; negative funding into support can set up sharp reversals. Coinglass explains why.
- Mind weekends and holidays. Thin books + leverage = air pockets. Barron’s coverage around the Sunday flush is a case in point.
- Policy isn’t a switch. 401(k) inclusion is real on paper, but plan architecture, fiduciary sign-off, and education take time—expect an adoption curve, not a light switch.
FAQs (today’s edition)
“BlackRock just sold $190M!”
More accurate: IBIT had a day of net outflows around that scale; outflows reduce fund shares and can result in redemptions, but it’s not the same as a discretionary sell order. Check the dated line items on Farside.
“Why did price ‘suddenly’ drop to ~$110K?”
Likely a combo of elevated long funding, thin weekend liquidity, and stop cascades. That’s consistent with prior episodes where derivatives positioning gets one-sided.
“Is the 4-year cycle still a thing?”
Cycles evolve as market structure changes (ETFs, macro, policy). Reuters noted this year’s run has leaned more institutional than prior cycles—still cyclical, but with different players.
Market narrative vs. market data
It’s tempting to anchor on the loudest forecasts: “$200K by Q4,” “$250K by year-end,” “$1M+ if advisors bless it.” The data says: volatility is policy + positioning.
We now have a policy framework that could widen access (401(k)s), a product wrapper that channels institutional demand (spot ETFs), and a derivatives layer that still overextends at times (funding spikes, OI surges). When all three align, rallies overshoot; when one reverses—say, a run of ETF outflows—the unwind is fast.
Bottom line
As of today, bitcoin news is a study in contrasts: price near $111K after a mechanical flush, ETFs printing a short outflow streak, and a brand-new policy door opening to retirement money. Throw in headline-grabbing targets from well-known strategists, and you get a noisy tape that still boils down to flows and funding.
If you’re trading, watch funding, OI, and ETF creations/redemptions. If you’re allocating, remember that policy milestones (like 401(k) access) are step functions, not instant rivers.